Male vs female
flymsg runs the same model on the male CNS (MaleCNS v1.0) and the female brain (FlyWire FAFB
v783, --dataset fafb, see data).
Cell types are matched through MaleCNS flywireType. Code: src/flymsg/compare.py.
Engine check
Before comparing sexes, the simulator is checked against the model it claims to reproduce.
The published brian2 code of Shiu et al. (repository commit 91bdd1e, brian2 2.10.1) and
flymsg ran on the same connectome (FAFB v783 with the model's own signs, shiu_sign), the
same 20 sugar GRNs (their list, one ID missing in v783), no adaptive threshold, 10 runs of
1 s per input rate.
| Sugar input | Pearson r, all active neurons | MN9 (CB0701_R), brian2 | MN9, flymsg | Downstream neurons > 10 Hz, median flymsg / brian2 |
|---|---|---|---|---|
| 50 Hz | 0.998 | 11.0 Hz | 12.5 Hz | 0.99 (42 neurons) |
| 100 Hz | 0.999 | 61.9 Hz | 60.5 Hz | 0.95 (205) |
| 200 Hz | 1.000 | 90.7 Hz | 88.0 Hz | 0.98 (273) |
MN9 varies by about ±4 Hz between brian2 runs at 200 Hz, so the two engines agree within
noise. The check found six places where flymsg had departed from the published model; the
last two (synaptic input reaching a refractory neuron is lost; refractory length) were only
visible at high rates and were isolated on a two-neuron network, which is now a regression
test (tests/test_core.py). Details in the findings log.
Reproduce: scripts/shiu_reference.py runs the brian2 reference (needs a separate
environment with brian2, see the script); compare.shiu_rates gives the flymsg side.
Synapse counts are not on the same scale
The tables of the next two sections are regenerated by flymsg compare (it loads both
datasets, so flymsg --dataset fafb fetch and build must have run):
| Table | Command |
|---|---|
| the density factor | flymsg compare |
| male vs female | flymsg compare --sex --seeds 3 |
| subtype fingerprints | flymsg compare --fingerprint LB3a LB3b LB3c LB3d |
| the LB3 split and MN9 per part | flymsg compare --lb3-split --seeds 10 |
Across 7,327 cell types matched through flywireType, a male neuron has a median 1.81×
the input synapses of its female counterpart (interquartile range of the per-type ratio about
1.4–2.4; output synapses the same). A factor this uniform across types is methodological —
MaleCNS was imaged by FIB-SEM at 8 nm isotropic and FAFB by serial-section TEM, with
different synapse detectors — not biological. With one w_syn for both, the male network is
driven about 1.8× harder, so raw comparisons between the datasets are confounded.
compare.synapse_density_ratio measures the factor; the comparison below multiplies the
female w_syn by it, so that the same biological connection weighs the same in both.
This also bears on the male model itself: w_syn 0.275 was tuned by Shiu et al. on FAFB, and
in MaleCNS it acts like a ~1.8× stronger synapse. It is why the earlier male model needed an
adaptive threshold; since v0.5 the default weight is density-scaled and uses none
(model).
Male vs female (flymsg compare --sex, runs/sex-comparison.csv)
Same model on both: the defaults (w_syn 0.192, no adaptive threshold) for the male, and the
female w_syn × 1.81, so that the same biological connection weighs the same; 3 seeds ×
300 ms per input rate. Only cases whose stimulus and target exist in both datasets can run:
P1, pIP10 and dPR1 have no FAFB counterpart (male-specific or unmatched) and TTMn lies in the
VNC, which FAFB lacks.
| Case (target) | Input | Male target | Female target | Shared types responding, male / female | Jaccard |
|---|---|---|---|---|---|
| sugar GRNs → MN9 (CB0701) | 50 Hz | 5.6 Hz | 46.7 Hz | 45 / 219 | 0.19 |
| 100 Hz | 30.0 Hz | 75.6 Hz | 229 / 254 | 0.39 | |
| 200 Hz | 80.0 Hz | 87.8 Hz | 269 / 262 | 0.43 | |
| LC4_R → DNp01 | 50 Hz | 161.1 Hz | 48.9 Hz | 256 / 185 | 0.34 |
| 100 Hz | 210.0 Hz | 82.2 Hz | 360 / 270 | 0.34 | |
| 200 Hz | 250.0 Hz | 133.3 Hz | 463 / 344 | 0.38 |
Stimuli: male LB3b_R + LB3c_R (17) vs the Shiu et al. sugar set (20, FlyWire left, all
FAFB type LB3); male LC4_R (55) vs female LC4_R (50). Both sugar runs measure the
contralateral pathway to MN9, the one Shiu et al. read: in the male right GRNs → MN9_L,
because MN9_R is flagged as incompletely reconstructed (data, "Reconstruction completeness");
in the female FlyWire-left GRNs → CB0701_R. Without the density correction the female
responded with far fewer shared types (runs/sex-comparison.csv, v0.3 defaults).
- A quarter to a half of the responding cell types are shared.
- The MN9 gap narrows once the readable pathway is compared: 30 vs 76 Hz at 100 Hz, 80 vs 88 Hz at 200 Hz. Part of the remaining gap fits the stimuli: the female set includes 6 LB3d-like neurons, which add about a quarter of the response (below). v0.5.0 compared the left male GRNs, whose contralateral target is the flagged MN9_R, and reported a "lateralised" MN9 (1.1 Hz); the audit makes a reconstruction artefact the most likely explanation.
- DNp01 responds 1.6–3.3× more in the male. The male GF has 3.9× the input synapses of the female GF, well beyond the 1.8× density factor.
- These are not yet dimorphism results. Each dataset is one animal; individual variability, reconstruction differences (proofreading, synapse detection beyond a global factor) and real sex differences cannot be separated with one fly per sex. The sugar stimuli also differ: the male set excludes LB3d, while Shiu's set includes 6 LB3d-like neurons (below).
Does the published sugar → MN9 response depend on LB3d-like neurons?
FAFB types all these labellar GRNs as one LB3; MaleCNS splits them into LB3a (water), LB3b/c
(sugar) and LB3d (high salt) (docs/validation.md). compare.nearest_male_type assigns each
of the 122 FAFB LB3 neurons to the male subtype with the most similar output profile
(flymsg compare --lb3-split, runs/lb3-fafb-split.csv; median margin between best and
second 0.11):
| Shiu et al. set | LB3a-like | LB3b-like | LB3c-like | LB3d-like |
|---|---|---|---|---|
| sugar (20 in v783) | 0 | 1 | 13 | 6 |
| water (17) | 13 | 0 | 4 | 0 |
| not in their sets (85) | 17 | 25 | 21 | 22 |
The water set lands on LB3a, the subtype matched to ppk28 (water), which supports the
method. The sugar set is 14 sugar-like and 6 LB3d-like neurons. Running the published model
(compare.shiu_rates: their signs, no adaptation, 10 × 1 s) on the parts
(runs/lb3-fafb-mn9.txt):
| Stimulus | MN9 at 100 Hz | MN9 at 200 Hz |
|---|---|---|
| all 20 (their set) | 62.1 Hz | 88.6 Hz |
| 14 LB3b/c-like | 44.7 Hz | 68.6 Hz |
| 6 LB3d-like | 5.3 Hz | 52.9 Hz |
| 6 random LB3b/c-like (3 draws) | 1.7–7.8 Hz | 36.1–43.1 Hz |
In the published model the sugar-like neurons carry most of the MN9 response (72 % at 100 Hz); the LB3d-like ones add about a quarter by summation and, neuron for neuron, drive MN9 at least as well as sugar-like ones at high rates. The headline result stands, with a contribution from neurons that one study matched to high-salt receptor lines. In the male model at the data's synapse scale the same split matters much more: LB3b+c alone leave MN9 silent, LB3b+c+d drive it (findings log).
Type mapping and a pilot circuit (#29)
flymsg homology writes validation/homology/:
mapping.csv, one row per male cell type and per FAFB type no male neuron names, and
mapping.meta.json with the schema (flymsg.homology/v1), the evidence (MaleCNS
flywireType, the release's call of the FAFB type of each male neuron), both datasets'
file hashes, the commit and the counts. Each male type gets one category, so a missing
match is not read as a missing cell:
| Category | Cell types | Male neurons |
|---|---|---|
| matched (flywireType in FAFB) | 7,422 | 136,434 |
| annotation not in FAFB table | 715 | 4,080 |
| outside FAFB tissue (VNC) | 3,118 | 19,312 |
| male-specific annotation | 288 | 1,363 |
| not mapped | 208 | 1,328 |
| female type with no male mapping | 1,511 | — |
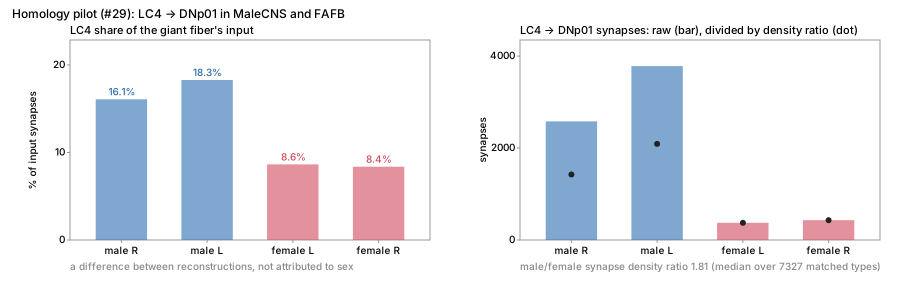
Pilot: LC4 → DNp01, the giant-fiber input of the looming case, present in both brains.
| Dataset | DNp01 | LC4 synapses | Divided by 1.81 | All input synapses | LC4 share of input |
|---|---|---|---|---|---|
| male | DNp01(GF)_R | 2,580 | 1,425 | 16,051 | 16.1% |
| male | DNp01(GF)_L | 3,782 | 2,089 | 20,684 | 18.3% |
| female | DNp01_L | 374 | 374 | 4,327 | 8.6% |
| female | DNp01_R | 431 | 431 | 5,147 | 8.4% |
The male giant fiber receives 3.7–4.0 times the female's total input, more than the median density ratio of 1.81 over 7,327 matched types, so most of the raw difference belongs to how each reconstruction saw this neuron. The LC4 share of each giant fiber's own input, which needs no global scale, is still about twice as large in the male. Neither table drops weak connections (the smallest weight is 1 in both). This is a description of two reconstructions, not a sex difference: the two volumes differ in imaging, segmentation and synapse detection, the giant fiber's large dendrite may be counted differently in each, and one animal per sex leaves no room for individual variation. A sex claim would need those ruled out first.